
In 2021, municipalities’ climate emissions remained at the previous year’s level
30.5.2023 08:00:00 EEST | Suomen ympäristökeskus | Press release

The greatest emission reductions were achieved in road transport, where the development has been driven by the increase in the bio share of liquid transport fuels (petrol and diesel). The total mileage also decreased slightly from the previous year.
Greenhouse gas emissions from district heat production increased by roughly five per cent, whereas energy consumption increased by 15 per cent. Emissions from district heat production per energy produced decreased by around 9 per cent.
The amount of electricity consumed increased by 8 per cent from the previous year, which meant that more fossil fuels had to be used in electricity production. Thus, the specific emission factor of electricity production also increased slightly from the previous year.
“2020 was exceptional, as the global pandemic stopped some of the normal functions of society, but the year was also very warm. Compared to the previous year, 2021 was clearly colder, and society had already begun to recover from the initial shock brought on by the pandemic,” says Santtu Karhinen, Senior Research Scientist at the Finnish Environment Institute, who is responsible for the calculations.
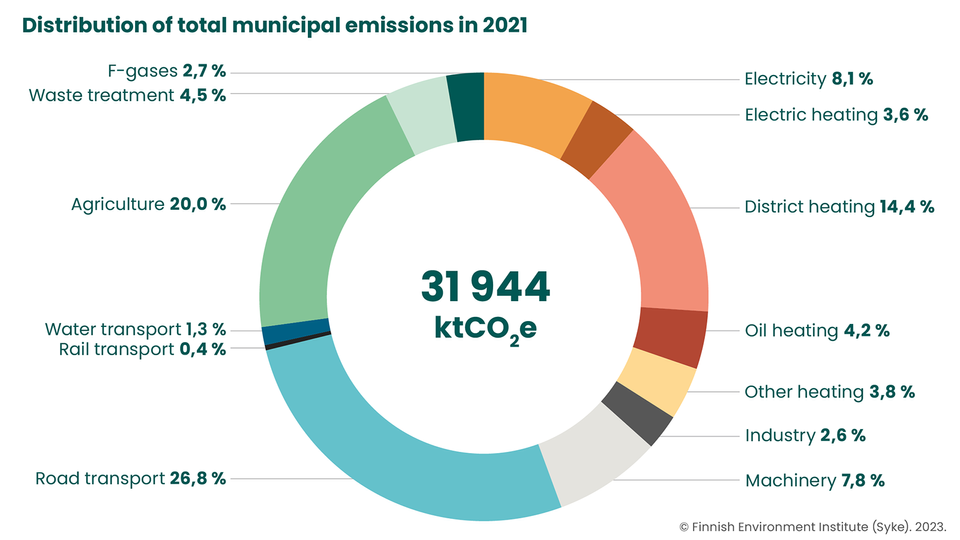
Emissions from waste treatment decreased by 5.4 per cent from the previous year, and the waste sector accounted for 4.5 per cent of total emissions in 2021. Emissions from waste treatment have decreased especially as a result of the recovery of landfill gas and limiting the landfilling of biodegradable waste.
Compared to the previous year, fluorinated greenhouse gas (F-gas) emissions decreased by 7 per cent and emissions from agriculture by slightly over 1 per cent.
The distribution of emissions between different sectors remained relatively unchanged from the previous year. The results from 2021 show that the main emission sectors, to which considerable emissions reduction measures should also be targeted, are road transport (27%), agriculture (20%), district heat consumption (14%) and electricity consumption (heating and consumer electricity totalling 12%).
However, positive emissions trends can be observed over a longer period of time. In 2005–2021, greenhouse gas emission decreased in almost all Finnish municipalities, by 27.7 per cent in total.
Emissions monitoring in the Climate Act
The Climate Act reform provides that a municipality must, at least once per council term, prepare or update a climate plan, which must include, among other things, information on the development of greenhouse gas emissions in the municipality. In accordance with the Climate Act, the Finnish Environment Institute maintains an emissions data service for municipalities and regions.
In the plans devised according to the requirements of the Climate Act, adherence to the limitations of the Hinku calculation rules implemented by the Finnish Environment Institute is advised, excluding carbon offsets. For this reason, the emissions data service maintained by the Finnish Environment Institute will, in the future, present emissions in accordance with the Hinku calculation rules without carbon offsets as the default for emissions monitoring. The general reporting and communications regarding the results will also include the monitoring of emissions data in accordance with the requirements of the legislation.
“In order to monitor the ambitious emissions reduction targets of the Hinku network municipalities, the emissions data service will also continue to present emissions in accordance with the Hinku calculation rules, including carbon offsets, in accordance with the previously agreed offsetting practices of the Hinku network. The results are available in the emissions information service without the limitations of the Hinku calculation rules, in addition to which the emissions data are available as differentiated for the effort sharing sector and emissions trading,” says Karhinen.
Differences in emissions per capita between regions
There are still considerable differences between municipalities and regions in the sectoral distribution of emissions and their development. As in the previous years, emissions per capita are lowest in the southern regions. However, relatively, emissions per capita decreased most in the northern regions of Lapland, North Ostrobothnia and Kainuu.
The regional differences are explained by factors such as differences in the economic structure (e.g. agriculture-dominated regions), geography (distances and community structure), weather conditions and fuel use in district heating.
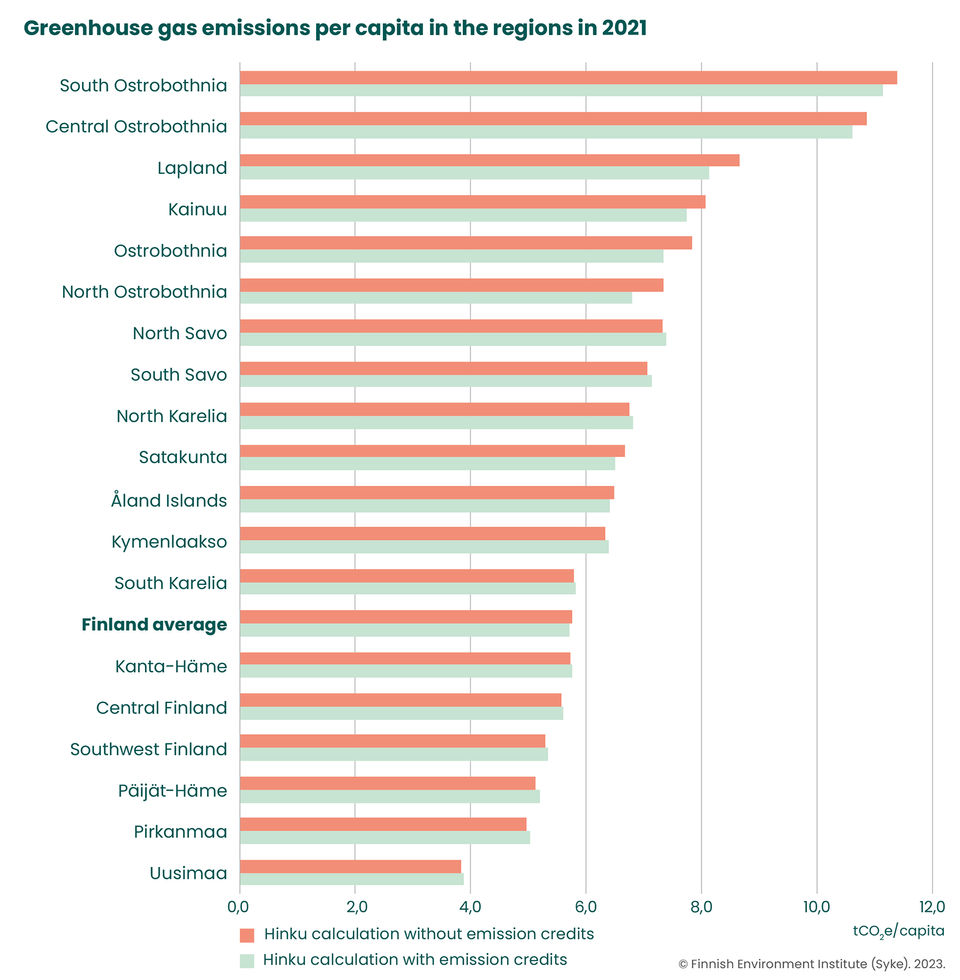 Greenhouse gas emissions per capita in the regions in 2021. Emissions have been calculated in accordance with the Hinku calculation rules. © Syke
Emissions calculation is developing
A few changes were made to the newly published emissions calculations, which, in addition to the results for 2021, also affected the previously published emissions time series. The characterisation factors used in the aggregation of the global warming potential (GWP) of different greenhouse gases were updated as the coefficients of the national greenhouse gas inventory changed. This change had an impact especially on the emissions results for waste treatment, agriculture and F-gases.
Industrial emissions calculation was modified so that the emissions of all emissions trading industries were excluded from the Hinku calculations regardless of gas. Methane and nitrous oxide emissions caused by the emissions trading industry belonging to the effort sharing sector had previously been included in Hinku emissions, which significantly increased the industrial emissions monitored in Hinku calculations in some municipalities.
In waste treatment emissions, wastewater calculation was specified by taking better into account the source of the wastewater and its treatment methods. The new approach distinguishes between emissions from centralised and decentralised wastewater treatment, which are divided for municipalities on the basis of the population numbers in their agglomerations and sparsely populated areas.
In road transport calculations, the emission factors related to street and road network mileage were specified, which also had an impact on the total emissions of road transport in municipalities.
Next, the emissions information service will be expanded to also include emissions data from 1990, as some municipalities have chosen it as the reference year for their emissions targets in their climate work. In autumn 2023, preliminary data on emissions for 2022 will be published, which will be finalised in spring 2024.
The municipal emissions calculation system has received funding from the Life IP Canemure project of the European Union.
Emissions calculation materials are publicly available:
Keywords
Contacts
Santtu KarhinenSenior research scientistFinnish Environment Institute
Tel:+35829 525 1889firstname.lastname@syke.fiEija FerreiraSenior research scientistFinnish Environment Institute
Oil and other separate heating
Juha GrönroosSenior research scientistFinnish Environment Institute
Agriculture
Tommi ForsbergCoordinatorFinnish Environment Institute
F-gases
Jouko PetäjäSenior research scientistFinnish Environment Institute
Landfills
Jyri SeppäläProfessorFinnish Environment Institute
National Director of the HINKU network
Images


Links
About Suomen ympäristökeskus

It is time to move beyond solving environmental problems one by one, to systemic sustainability transformations. The Finnish Environment Institute (Syke) contributes to building a sustainable society through research, information and services. The Finnish Environment Institute is a research institute with 700 experts and researchers located in Helsinki, Oulu, Jyväskylä and Joensuu.
Subscribe to releases from Suomen ympäristökeskus
Subscribe to all the latest releases from Suomen ympäristökeskus by registering your e-mail address below. You can unsubscribe at any time.
Latest releases from Suomen ympäristökeskus
Viikkokatsaus 30.3–2.4.202626.3.2026 13:34:03 EET | Tiedote
Hei! Tässä tiedoksesi meillä Suomen ympäristökeskuksessa ensi viikolla ilmestyviä tiedotteita, uutisia, kampanjoita, blogeja ja uutiskirjeitä. Mukana myös tulevia tapahtumia ja webinaareja. Jakelemme viikkokatsauksen torstaisin STT:n kautta. Koosteet löytyvät myös STT-uutishuoneesta, josta voit tilata kaikki Suomen ympäristökeskuksen tiedotteet.
Torkan fortsätter vara utmanande – många sjöar och grundvattennivåer är låga26.3.2026 07:00:00 EET | Pressmeddelande
Grundvattennivåerna ligger under det normala i stora delar av landet, med undantag för Lappland. Situationen har förvärrats av en ovanligt snöfattig vinter, långa köldperioder, en tidig vår samt en långvarig torka särskilt i östra Finland. Enligt prognosen kommer de stora sjöarna i östra Finland att förbli låga även i år. Vårens och sommarens torka kan påverka tillgången på vatten, jordbrukets skördar, risken för skogsbränder, vattentransport, rekreationsanvändningen av vattendrag samt energiproduktion. Nederbörden under våren avgör vilka effekter torkan slutligen kommer att ha.
Kuivuustilanne jatkuu haastavana – monet järvet ja pohjavedet matalalla26.3.2026 07:00:00 EET | Tiedote
Pohjavesien pinnat ovat tavanomaista matalammalla useilla alueilla Lappia lukuun ottamatta. Tilannetta ovat pahentaneet poikkeuksellisen vähäluminen talvi, pitkät pakkasjaksot, aikainen kevät sekä erityisesti Itä-Suomessa pitkään jatkunut kuivuustilanne. Ennusteen mukaan Itä-Suomen suuret järvet pysyvät tänäkin vuonna matalalla. Kevään ja kesän kuivuus voi vaikuttaa talousveden riittävyyteen, maatalouden satoihin, maastopaloihin, vesiliikenteeseen, vesistöjen virkistyskäyttöön ja energiantuotantoon. Kevään sademäärät vaikuttavat lopullisen kuivuustilanteen kehittymiseen.
Muovi ei kuulu maaperään vaan kiertoon – puutarhurin muovivalinnat näkyvät maaperässä pitkään24.3.2026 07:30:00 EET | Tiedote
Muovi on vakiinnuttanut paikkansa paitsi kodeissa myös kotipuutarhoissa: ruukuissa, katteissa, sidontanaruissa ja multapusseissa. Oikein käytettynä se kestää ja kiertää. Maaperään päätyessään muovi ei kuitenkaan katoa, vaan pilkkoutuu mikromuoviksi, joka voi säilyä ympäristössä pitkään.
Tutkijat: Suomessa ei tunnisteta energiaköyhyyttä23.3.2026 07:03:50 EET | Tiedote
Suomalaisista kotitalouksista noin 7–15 prosenttia on energiaköyhiä, mikä suurimmillaan tarkoittaa noin 300 000 kotia. Aalto-yliopiston ja Suomen ympäristökeskuksen tuoreen tutkimuksen mukaan energiaköyhyys liittyy muun muassa lämmitysmuotoon, asuinpaikkaan, työmarkkinatilanteeseen, perhekokoon ja sukupuoleen.
In our pressroom you can read all our latest releases, find our press contacts, images, documents and other relevant information about us.
Visit our pressroom